AI-powered dashboards
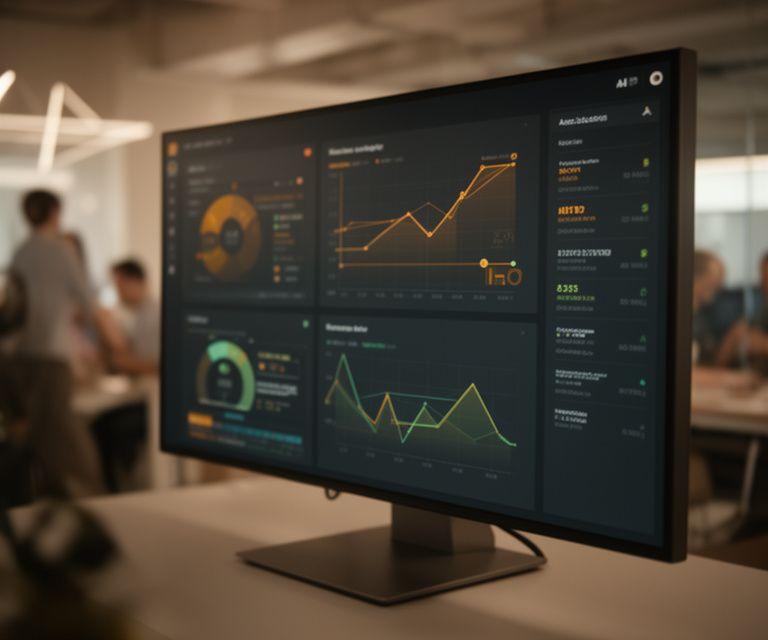
Visualise performance, forecast demand, and surface anomalies before they become expensive. Why read ten reports when one view can tell the story?
Explore the platformVerdant Insight builds AI-powered dashboards that turn fragmented data into clear action. With custom model integration, predictive analytics, and real-time monitoring, you'll spot risk early and move faster than the market. Why keep guessing?
Trusted by data-driven teams across the UK
We work with operations leaders, analysts, and founders who need certainty, not clutter. Based at 10 Rounds Green Road in Sandwell, we support businesses across the UK with dashboards that are built to be read in seconds. Sounds simple? That’s the point.
What we build
Need a dashboard that does more than report history? We design around your workflows, your KPIs, and the moments where action matters most. That’s where good software earns its keep.
Visualise performance, forecast demand, and surface anomalies before they become expensive. Why read ten reports when one view can tell the story?
Explore the platformPlug forecasting, classification, and scoring into the systems you already use. No messy detours. No blind spots. Just usable intelligence.
Explore the platformTrack live feeds, trigger alerts, and keep teams aligned when conditions change. Fast enough for operations, clear enough for leadership.
Explore the platformFrom raw data to real-time insight
We start by mapping your data flow and the decisions tied to it. Then we shape the model, build the interface, and tune the experience until it feels natural. Simple? Yes. Easy? Not without the right team.
See the full processWe review sources, gaps, and reporting pain points. What’s worth measuring?
We wire in the AI logic and connect it to your stack without disrupting daily work.
The dashboard ships with monitoring, alerts, and support baked in from day one.
We stay close after launch. Because good insight needs upkeep, doesn’t it?
Built for the sectors that run on data
Forecast demand, trim waste, and keep the right stock in the right place.
Keep a live eye on cash flow, thresholds, and operational drift.
Predict maintenance, spot bottlenecks, and protect service levels.
Track utilisation, project health, and performance without spreadsheet sprawl.
What our clients say
The best product proof is quiet confidence from the people running the numbers. Need to know what changed after rollout? Listen to the operators.

“The dashboard rollout cut our decision time down almost immediately. We stopped arguing over versioned reports and started acting on the same live picture. Why didn’t we do this sooner?”
“Predictive analytics helped us reduce wasted stock and plan with confidence. The numbers finally made sense at a glance.”
“Custom AI integration was smoother than expected. Their team understood our legacy systems and kept the whole thing practical.”
Ready to put your data to work?
We usually reply within one business day. Bring us a messy spreadsheet, a reporting headache, or a live monitoring problem; we’ll show you a cleaner path forward. Ready?